How our rankings work
We know that each technology center presents its own unique set of challenges. And, perhaps more importantly, we know that firm expertise in a specific field is often more sought after than general aptitude. And so, rather than ranking firm performance across the entire USPTO, we narrowed in on each tech center to find the best of the best within each particular area.
Juristat's rankings consider both volume and performance in that specific technology center. We based the rankings on how well a firm performed in three key metrics over a 12-month period. These metrics are:
- Number of applications filed
- Allowance rate
- Average number of office actions before allowance
This analysis was conducted between December 2022-February 2023 and analyzed public applications disposed (or in the case of the first metric, applications filed) between January 1, 2020, and December 31, 2020. To qualify for inclusion, a firm must have filed a minimum of 100 applications in the tech center during that time period. This ensures the firm has extensive experience in that technology center and provides an appropriate-sized dataset to evaluate performance metrics. For our analysis, we attributed applications to the firm listed on the application at the time of disposition. We also excluded foreign priority applications and design applications from this analysis.
We narrowed the field in each technology center by first identifying the top ten firms in each of three categories – allowance rate, average office actions before allowance, and volume of applications filed. As you look at each tech center’s rankings, you see the top ten in each of those three key metrics, as well as our overall ranking – the Juristat Rank. This overall rank was calculated by taking into account the firm’s rank for the key metric, as well as rewarding firms who ranked for more than one category. This gives us a better picture of which firms have the most well-rounded performance in each tech center.
A caveat, of course. This method is but one way to measure a firm’s performance and is not intended to be definitive. In fact, you should not rely solely on a firm’s filing volume, allowance rate, or number of office actions as a measure of success - as that doesn’t necessarily account for patent quality. Beyond that, many clients value timeliness, communication, retention of top talent, or adoption of new technologies – more qualitative measures we can’t yet analyze with data.
Additionally, these rankings represent a snapshot of performance at the time of analysis. This analysis of public applications was conducted between December 2022-February 2023. Make sure you have the most up-to-date performance metrics by subscribing to Juristat.
FAQs
Does a firm have to use your services to make the list?
No! Firms do not have to use Juristat, nor do they need to apply to participate in the rankings. The Top Patent Firm rankings are powered by our industry-leading database of more than 10 million patent applications. This is the very same database that makes our tools so robust.
Why exclude design and foreign priority?
Design patents tend to have higher than average allowance rates, which can throw off the analysis. Comparing a firm that does all utility patents with a firm that has even one design patent would put the latter at an advantage. As you notice, we also skipped ranking firms in TC 2900 where most/all the design patents are assigned.
Similarly, we exclude foreign priority applications to level the playing field for the analysis as foreign priority applications generally have a higher allowance rate.
Why require a threshold of 100 applications filed in the technology center?
Is this limited to U.S. patent firms?
This list (and all those featured on our blog) are powered by our database of more than 10 million patent applications at the USPTO. Our database includes global and foreign law firms to the extent they prosecute applications under their own name in the United States. Many foreign firms choose to file applications through another U.S. firm and may not be included in this analysis.
Why isn't my firm ranked?
If your firm did not rank, it could be for a number of reasons. 1.) You may not have been one of the top-performing firms in that technology center. 2.) Your firm may have been excluded because you didn’t have 100+ filings in the particular technology center during this time period. Keep in mind, this analysis only considers published applications and excludes design and foreign priority. Credit is given to the firm at disposition as listed on the final application. Or, 3.) This particular research was conducted between December 2022-February 2023, and represents the Top Patent Firms based on data available at that time. These lists went through extensive review and quality assurance before publishing. Keep in mind, however, Juristat is constantly reprocessing to pull in new data. This gives our clients access to the most robust patent database on the market. It also means that specific metrics tend to change slightly over time as more information is added into the dataset. Juristat is constantly acquiring data from multiple sources, including Patent Center, Global Dossier, PEDS, the weekly Publication and Issuance Gazetteers, the Assignments data feed, and more.
Can I see my rank? Can I see the data behind these rankings?
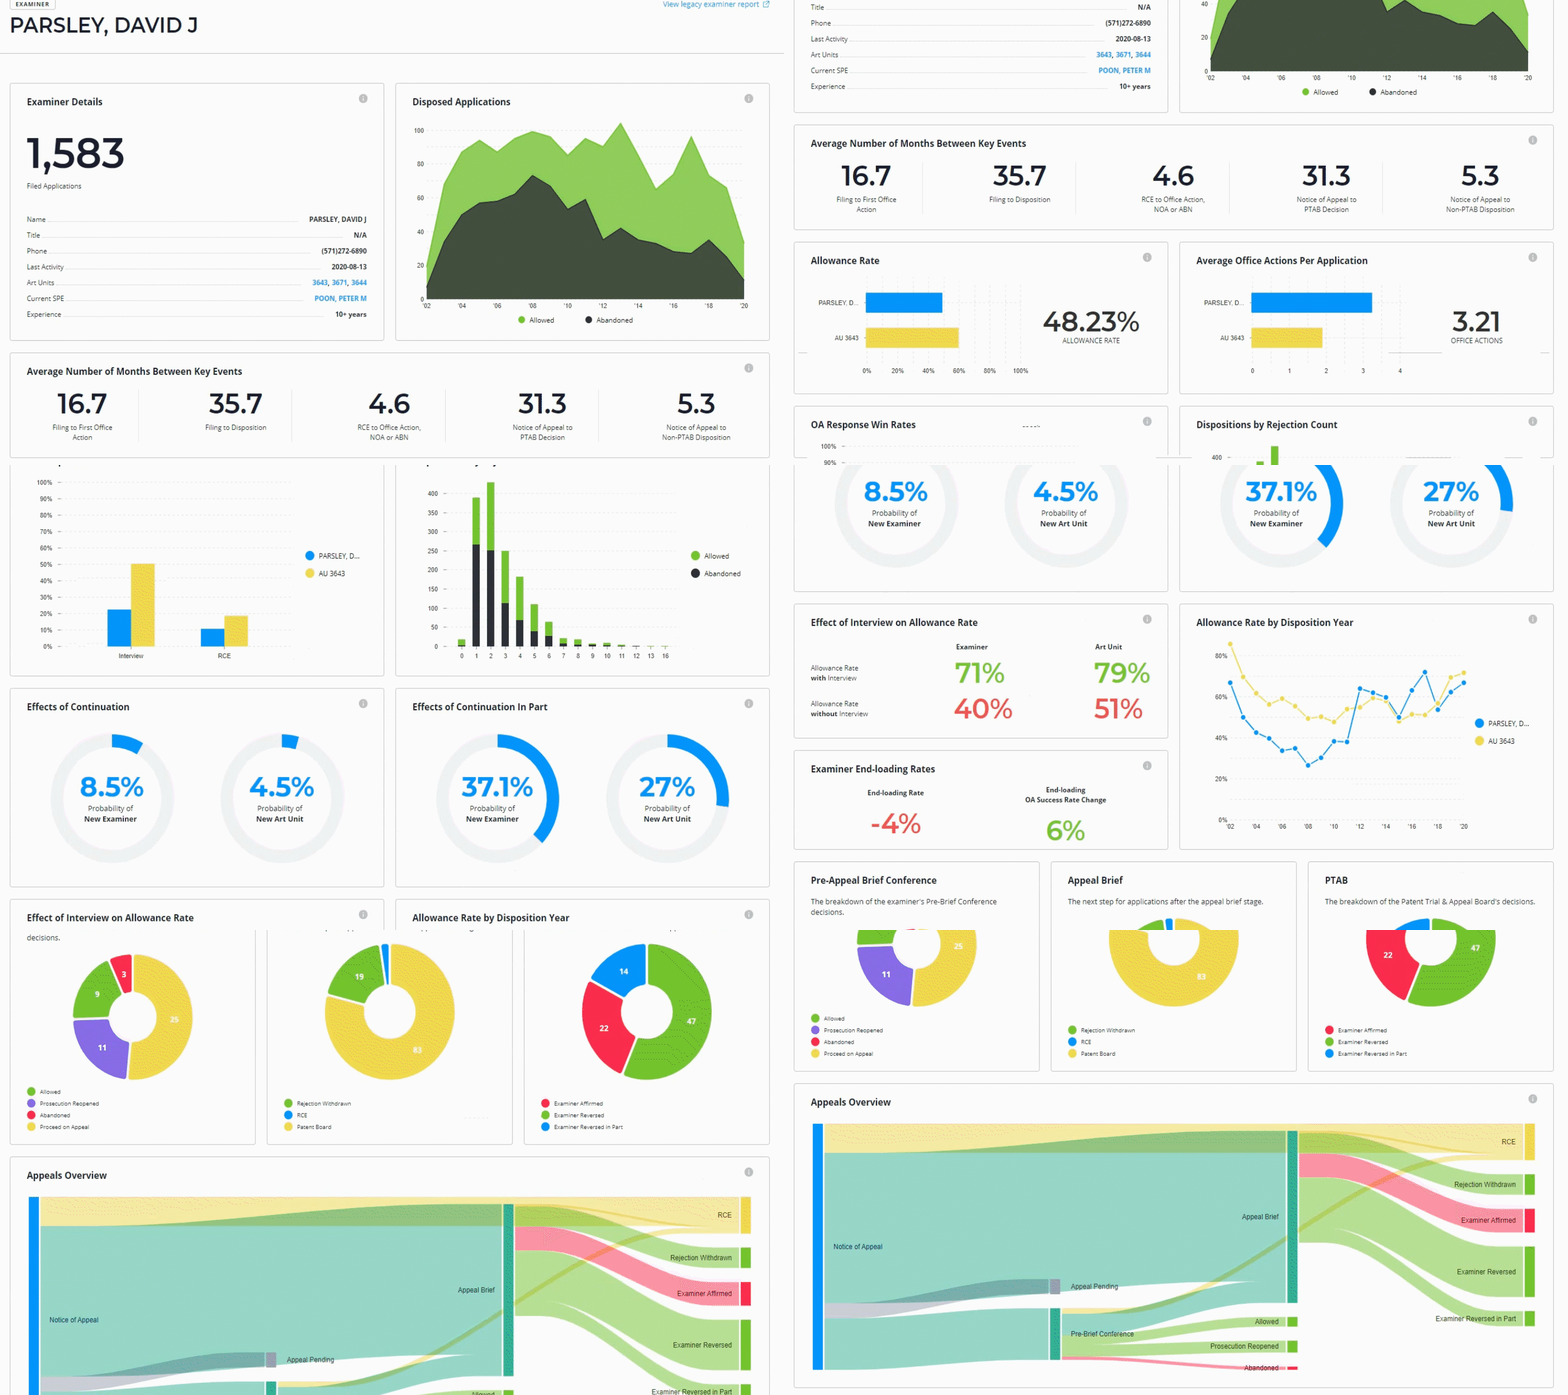
While we can’t share the raw data or rank for every firm, this data was all compiled using Juristat Analytics. Our powerful search and filtering capabilities, along with the ability to quickly export large datasets, makes in-depth analysis like this possible. Additionally, our side-by-side intelligence reports make it easy to compare metrics from firms, companies, centers, art units, classes, and more. If you'd like to see how our reporting works, set up a call with us.
Can we get on the list next year?
There’s no call for participation or entry fee associated with our Top Patent Firms lists. These rankings (and all those featured on our blog) are powered by our industry-leading database of more than 10 million patent applications. If you'd like to discuss ways to identify opportunities and improve prosecution outcomes, schedule a consultation with our team.

Transform your IP practice with data
Modern patent professionals rely on analytics to make strategic, data-driven decisions. With industry-leading performance metrics, side-by-side comparison reports, and powerful search and filtering abilities, you'll be on your way to more successful prosecution outcomes.
Learn more about patent analytics. →

WEBINAR
Competitive Intelligence for Firms and In-House Counsel
Business intelligence analytics are a powerful tool to help both firms and in-house teams identify areas of strength, risk, and competition more effectively.
Sign up for our newsletter.
Get the latest Juristat news and insight delivered right to your inbox.
(gradient).webp)

